Specialist training software for advanced methods
We were tasked by the University of Minnesota to develop a training software platform to support the interactive teaching of epidemiological methods. TOOLS/savi currently consists of three modules.

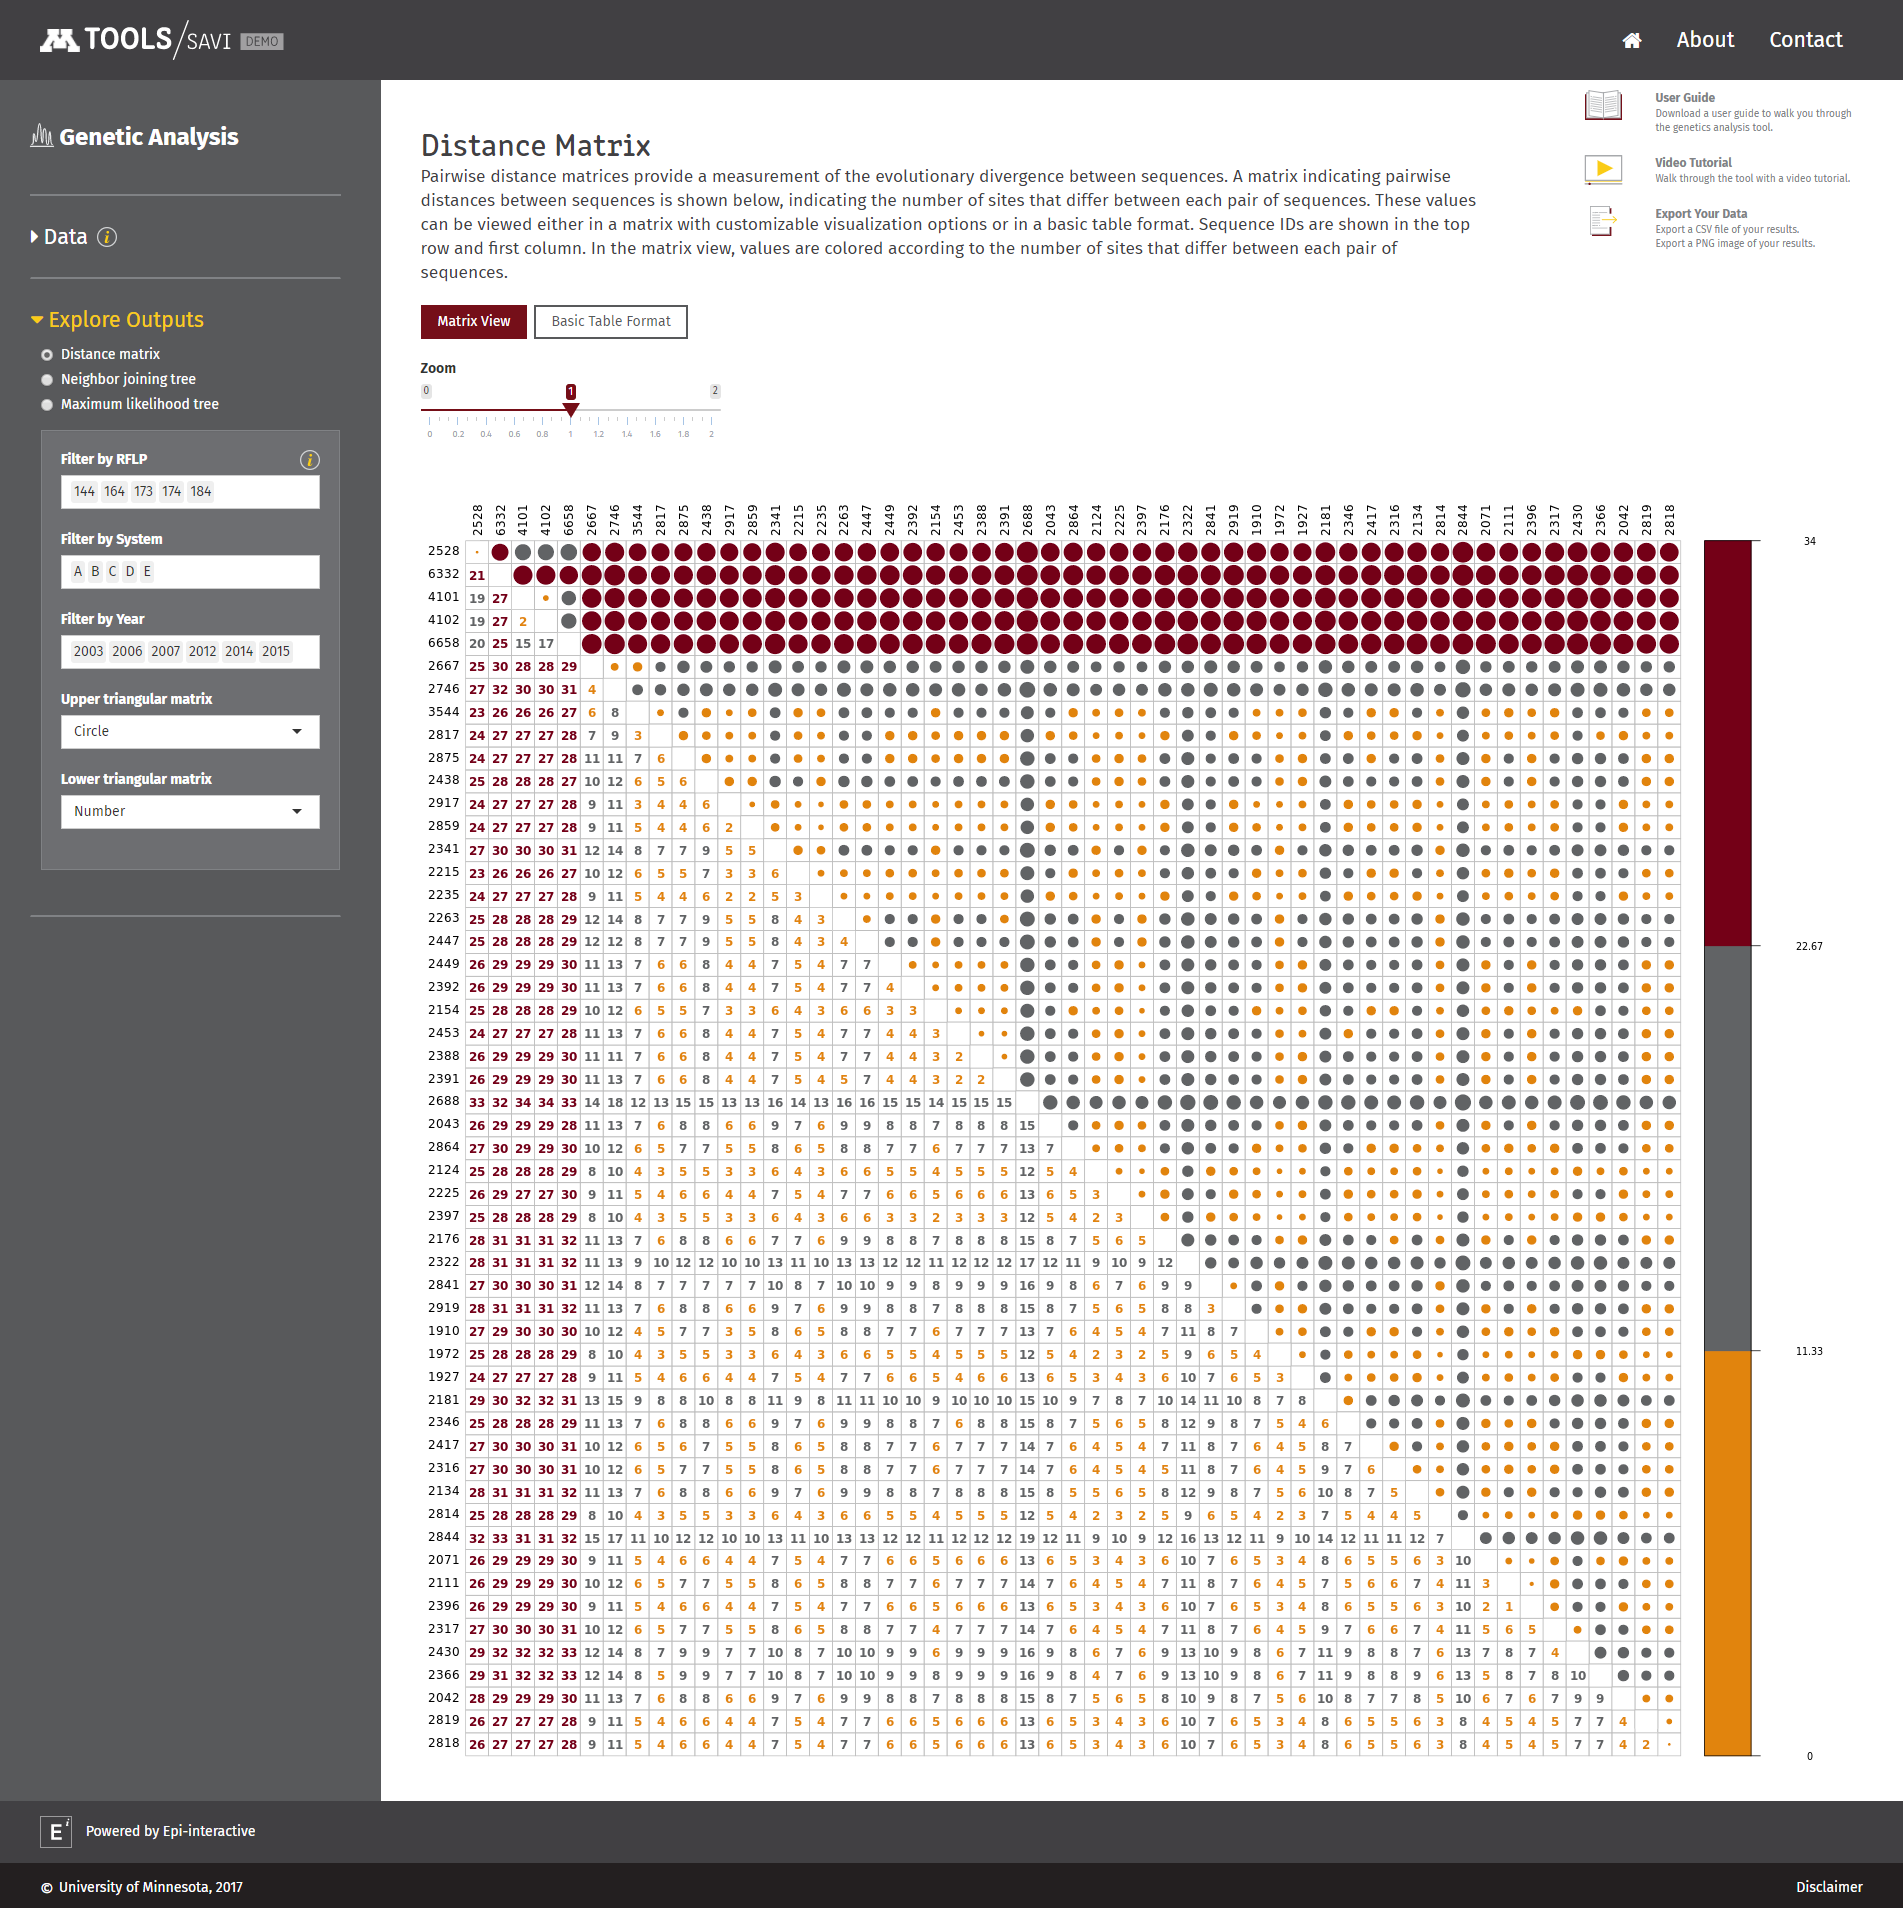
Genetic analysis
Nucleotide sequence data can be used to infer important relationships between isolates. To facilitate data analysis and visualization, the genetic analysis module allows you to explore the genetic distance between isolates and create customized phylogenetic trees based on different assumptions.
OptiSample
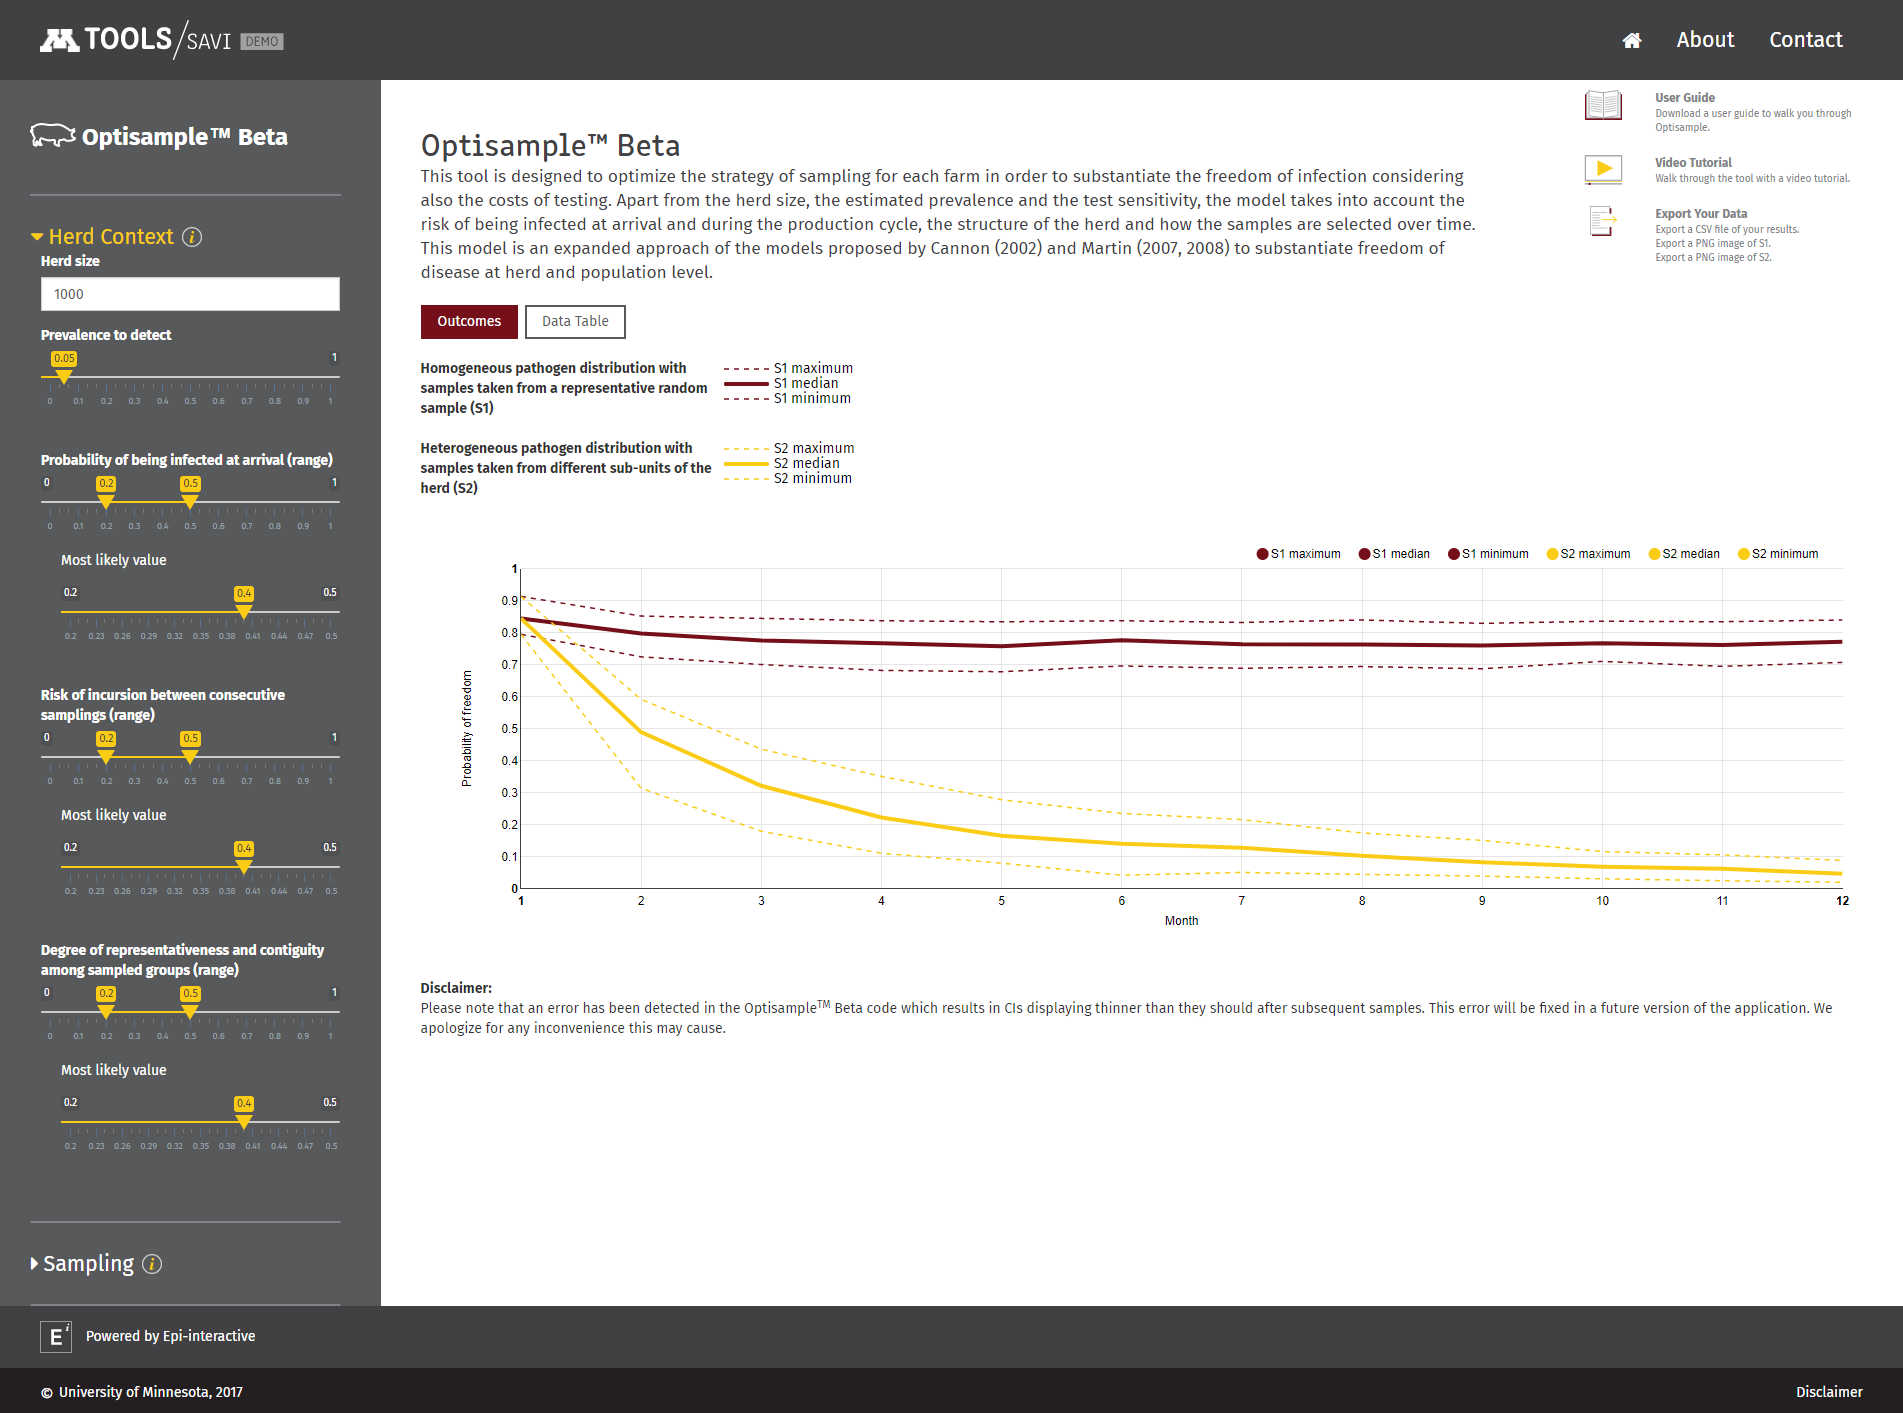
Optimum surveillance strategies may differ depending on the epidemiological conditions of the farm, including infection status, structure, management, or resources for conducting samplings. OptisampleTM Beta was designed to optimize farm sampling strategies for early detection of pathogens or to substantiate freedom of infection, while also considering the costs of testing.
Alba, A., Morrison, R.E., Cheeran, A., Rovira, A., Alvarez, J., et al. (2017) OptisampleTM: Open web-based application to optimize sampling strategies for active surveillance activities at the herd level illustrated using Porcine Respiratory Reproductive Syndrome (PRRS). PLOS ONE, 12(7), e0176863
Network analysis
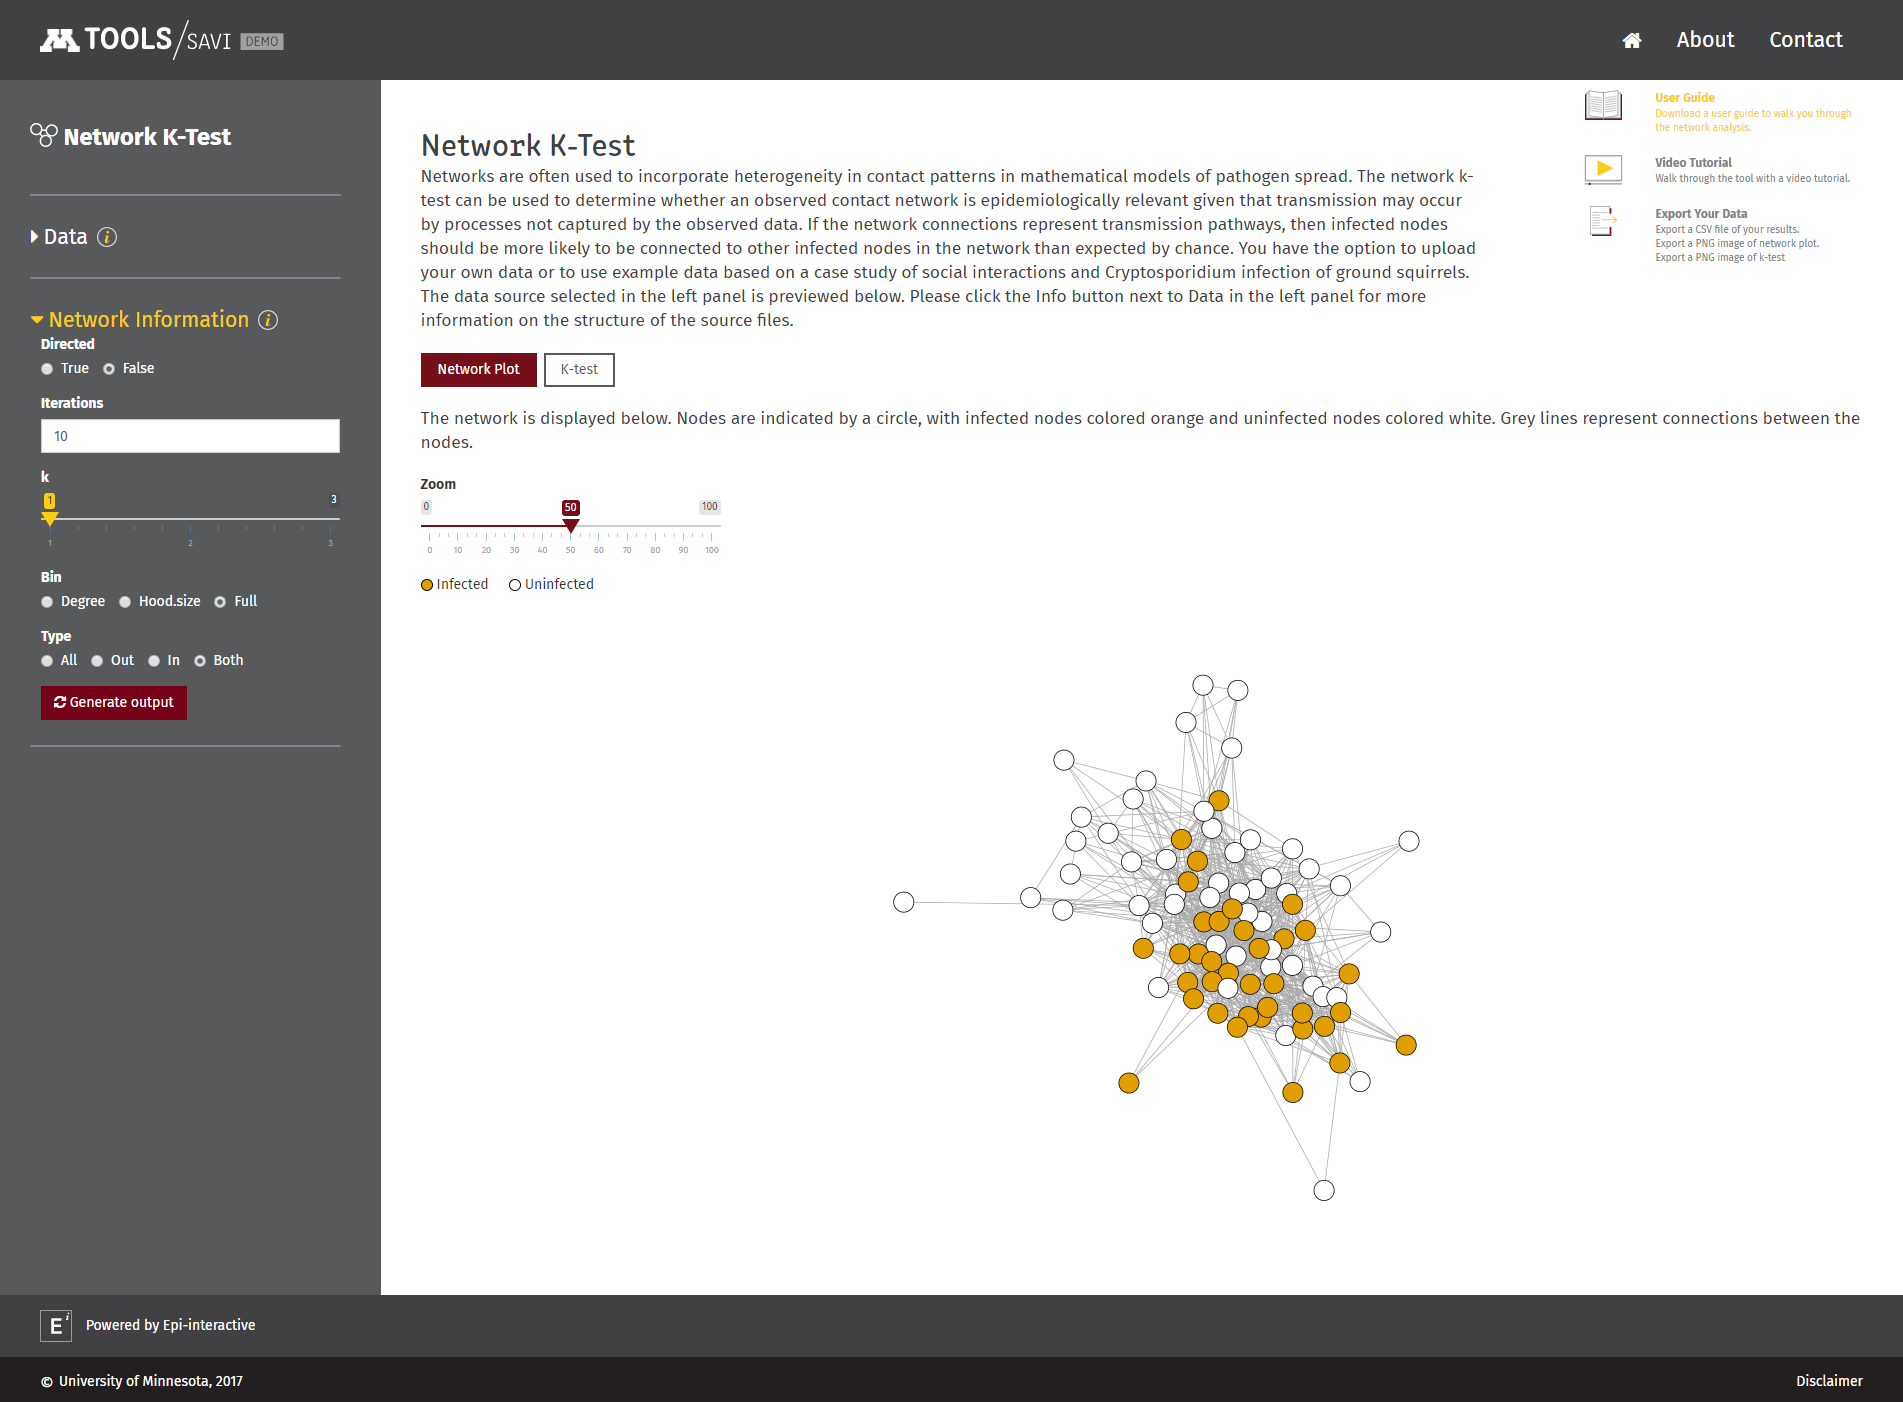
Networks are often used to incorporate heterogeneity in contact patterns into mathematical models of pathogen spread. The network k-test can be used to determine whether an observed contact network is epidemiologically relevant given that transmission may occur by processes not captured by the observed data. If the network connections represent potential transmission pathways, then infected nodes should be more likely to be connected to other infected nodes in the network than expected by chance.
VanderWaal, K. L., Enns, E. A., Picasso, C., Packer, C. & Craft, M. E. 2016. Evaluating empirical contact networks as potential transmission pathways for infectious diseases. Journal of the Royal Society, Interface / the Royal Society, 13, PMID 27488249 DOI: 10.1098/rsif.2016.0166.
Users have the option to use provided example data or to upload their own data. They can explore their own data within the tool and also export results (both in csv as well as image format).
Please contact Andres Perez from the University of Minnesota if you would like to access TOOLS/savi (aperez@umn.edu)
Publications
Muellner P, Muellner U, Ahlstrom C, VanderWaal K, Alba A, Alvares J, Perez A. Bridging the gap – an interactive self-study tool for advanced epidemiological methods. Proceedings of the 15th Symposium of the International Society for Veterinary Epidemiology and Economics (ISVEE), Chiang Mai, Thailand, 2018.
Presentations
Muellner P, Muellner U, Ahlstrom C, VanderWaal K, Alba A, Alvares J, Cheeran A, Perez A. Epi by doing – building an interactive Shiny platform for teaching at the University of Minnesota. Australian and New Zealand College of Veterinary Scientists (ANZCVS) Science Week, Surfer’s Paradise, Australia, 2017.