Strengthening One Health intelligence
EMPRES-i + is FAO’s modernised global health intelligence and early warning platform to improve forecasting and enable countries to monitor disease spread and risk of new outbreaks. Consultants from our team supported the recent upgrade of the platform through specialist R Shiny dashboards which allow user to explore in detail the space-time occurrence and epidemiology of key diseases in different livestock species.

A need to strengthen one health intelligence and early warning globally
Timely and reliable disease information enhances early warning and response to transboundary animal diseases and emerging zoonoses. It supports early action, prevention, improved response and progressive approach to control food security threats.
“The world must be alert to new threats from animal diseases, with COVID-19 underlining the need for greater vigilance, the Food and Agriculture Organization of the United Nations (FAO) urged today, as it launched a new global animal disease information system.”
“Today’s globalized and hyper-connected world allows the rapid spread of diseases across borders. In this context, disease intelligence systems need to be far more efficient at capturing big data, far more sensitive to detect unusual events, and have the ability to rapidly share information.”
- FAO press release (access the full text here)
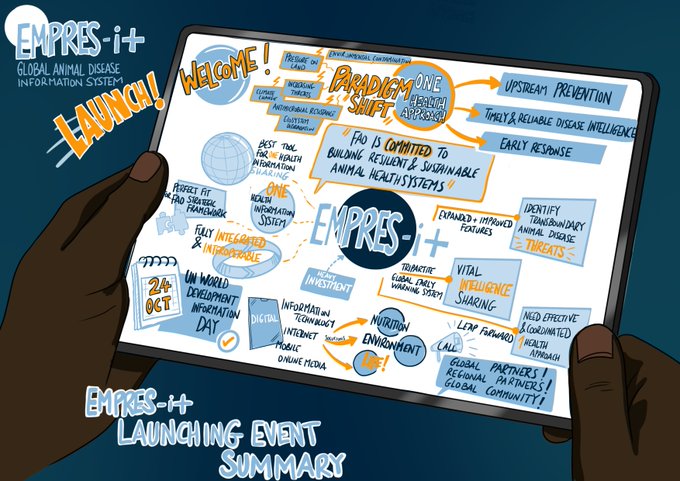
Image credit: FAO
Deep collaboration with in-house experts
Our consultants co-designed, together with FAO’s technical experts, a set of specialist dashboards which we then developed in R Shiny. We also helped the FAO IT team to set up the underlying data and system infrastructure to integrate the dashboards into their wider platform.
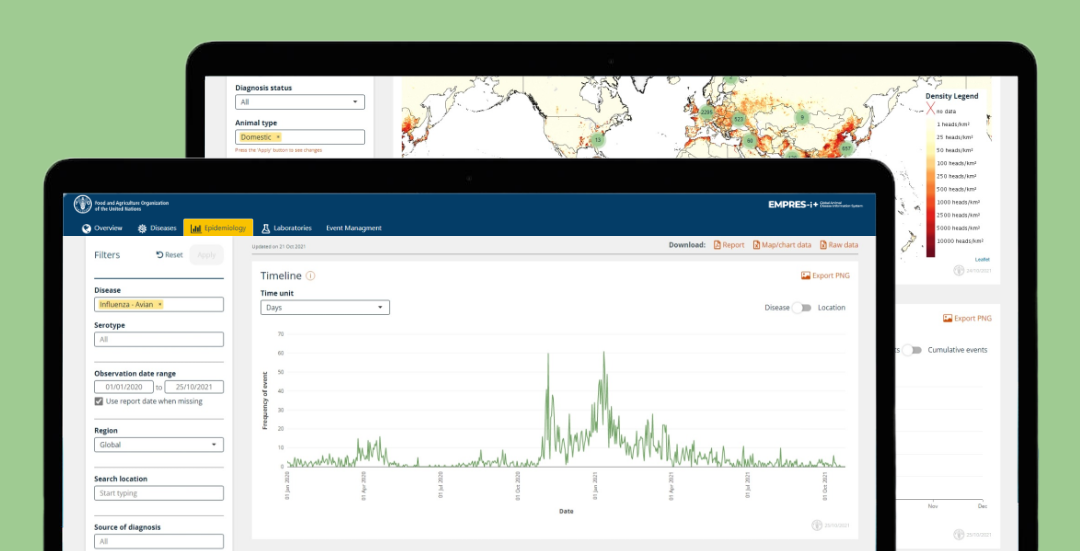
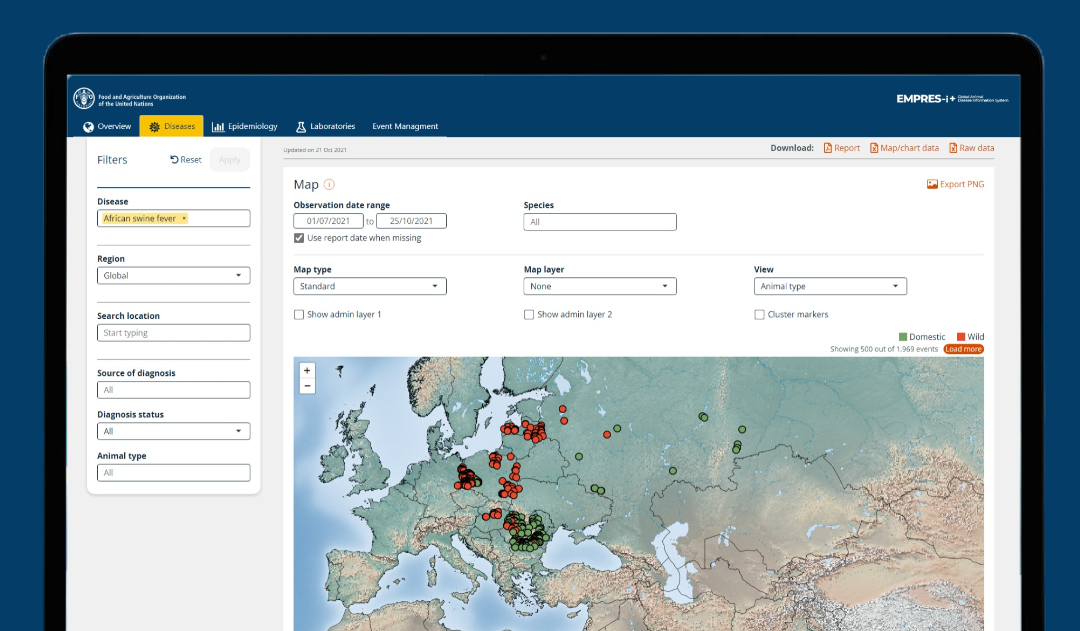
Custom views
The specialist dashboards we created show the spatial distribution of global diseases, including highly customisable map views. The filters allow the user to delve deeper into which locations, dates and species they are interested in. Several options for visual customisation of the map are included, from topographic views to adding livestock density layers. A special section allows users to interactively explore epidemiological risk factors and the diagnostic status of cases.
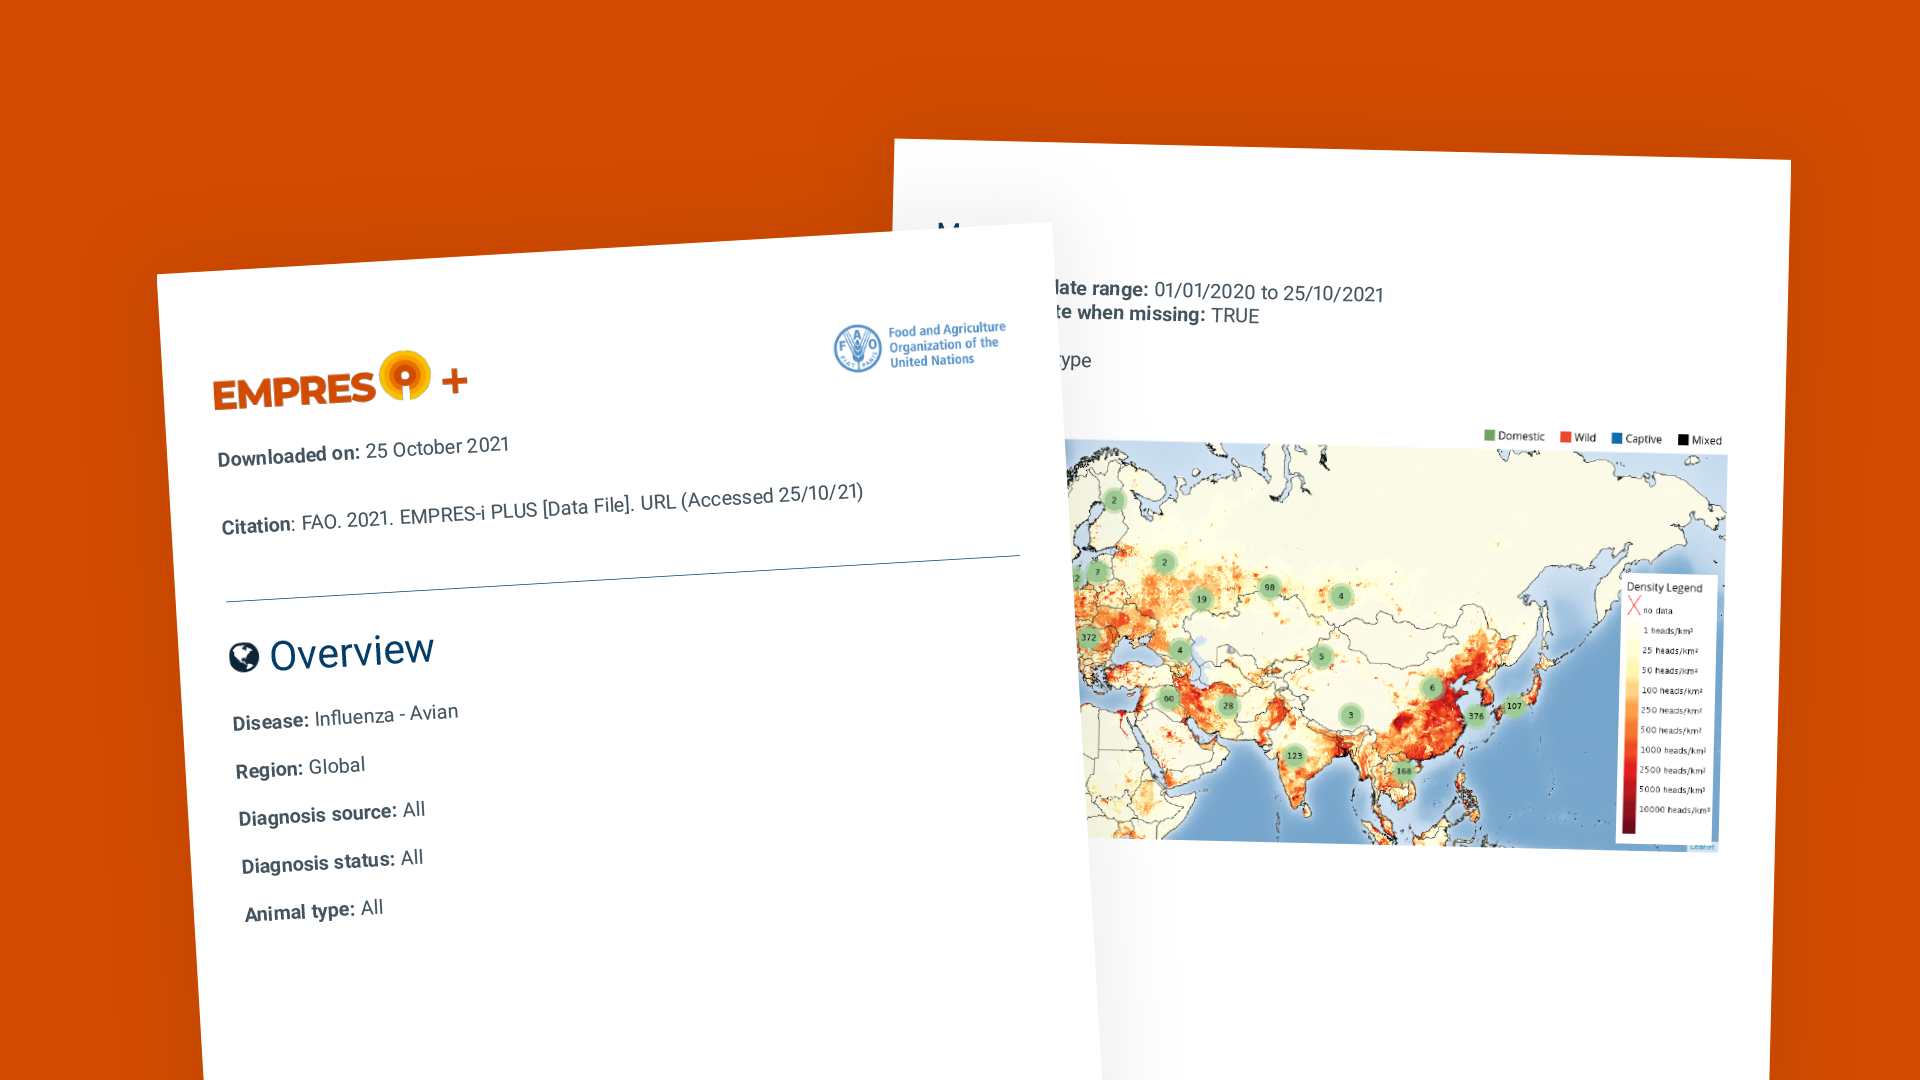
Easy access to data and reports
The new EMPRES-i + makes it easier for stakeholders to self-service information from the platform. Available formats include customised PDF reports, data in CSV format and PNG images of all data visualisations. This gives the user the option to export their findings in the format that they find the most useful.