R Exchange aims to showcase how organisations are using R and other open-source tools to visualise insights, automate reporting, scale up work flows to better connect data with decision-making and to align data insights with strategic goals. Open source tools are commonly used to complement proprietary products to tackle more complex problems to provide analysts and data scientist with the flexibility they need for their work. If you are not working with open-source tools yet, get inspired by how others use them and what can be done!
Whether you're taking first steps or already are an expert, our diverse programme caters for different levels of interest. Meet with fellow open-source enthusiasts to connect and learn about best practices and what is new in the open-source data science and analytics world.
Our full-day conference on Thursday 9 May, will feature keynotes, presentations, and a panel discussion about enabling open-source data science and analytics. Speakers will showcase real-world examples and experiences which will help you get the most out of freely available tools and link into powerful features such as R Shiny dashboards or Quarto reports.
If you have any questions, please don’t hesitate to contact us events@epi-interactive.com and keep up-to-date on the latest announcements via LinkedIn and our newsletter.
Where
The Auditorium,
Aitken Street entrance,
National Library of New Zealand,
Wellington
When
Thursday 9 May
Speakers


Conference schedule
Thursday 9 May
8:15am
Doors opens
Come early for a chat with your peers over a good coffee or tea
9:00am
Welcome and introduction
9:15am
Smart open-source data science – what leaders (and their teams) should know
Posit
Using his experience from helping over 200 organizations, including many from the public sectors, Jeremy will share tangible critical success factors every data science leader needs to consider now. These include managing stakeholders and creating buy-in, common mistakes, supporting your people, investing in an effective and safe open-source tech stack, and how to put relevant insights in front of the right decision-makers.
9:40am
openFMD: A digital platform to support Foot-and-Mouth Disease global surveillance
The Pirbright Institute
Digital technologies have transformed many aspects of pathogens surveillance, as we recently witnessed with the application of precision epidemiology to pandemic response. In collaboration with EPI-interactive, the FAO World Reference Laboratory for Foot-and-Mouth Disease has developed openFMD, a global repository and visualisation platform for Foot-and-Mouth Disease. By enabling research and policy through FMD virus genomics and surveillance tools, openFMD aims to improve timely analysis and communication of FMD surveillance data, identification of surveillance gaps and provide evidence-based decision-making processes for FMD control.
10:05am
Integrating R with HPC – success stories from pharmaceutical research
HPC Now
Roche's HPC (High Performance Computing) clusters for pharmaceutical research heavily rely on the use of the R; however providing R and its panoply of packages to thousands of scientists is not an easy task. In this talk Guillem will give us a glimpse of how Roche achieves this on a daily basis, allowing the users to access extensive computational resources (CPUs, GPUs and storage) and to create state-of-the-art scientific outputs for pharmaceutical research.
10:20am
Q&A
10:30am
Morning tea break and networking
11:15am
From experience-based operation to standard operating procedure: An example of workflow automation at The Treasury
The Treasury New Zealand
The updatefi package was tailored around the workflow of updating fiscal indicators for the Economic and Fiscal Updates from the Treasury. It aimed to transform an experience-based operation into a standard operating procedure. The package consists of a set of functions that automate the workflow under the supervision of analysts. A comprehensive Quarto document is also made available as a mandatory component of the package.
The development of updatefi started just before BEFU 2023; functions were incrementally completed and applied for the preliminary and final rounds. The fully developed package has been used to update fiscal indicators since PREFU 2023. Empirical evidence shows that compared to before, the usage of the package has reduced the time required for updates and eliminated human errors involved in the process. The outputs generated are fully referenced and reproducible, leading to an increase in the transparency of the updating process.
11:30am
Maintaining order amidst chaos with open-source workflow
Ministry for the Environment, Manatū Mō Te Taiao
The National Monitoring System (NMS) project is an annual audit of local government performance under the Resource Management Act. A total of 78 councils are required to collect their NMS data in a spreadsheet template, and submit it to the Ministry for the Environment (MfE) through a mailbox. The data team at MfE then reviews, processes, and consolidates the data for various reporting purposes. There is extensive communication between MfE and councils throughout this process. The form of an excel spreadsheet also creates significant challenges when it comes to data cleaning and processing.
Lillian Lu is a senior data analyst from MfE and the technical lead for the NMS project. In this talk, Lillian will walk you through how the team leverages different functionalities in R to manage the complex NMS workflow, including Shiny app and R package development. While the current solutions are not perfect, as the root of the problem lies in how the data is collected, the team hopes to demonstrate the potential of utilising open-source technology to maintain order amidst the chaos, especially for low-budget projects.
11:50am
The AI tools revolution: Accelerating efficiency in data science
Epi-interactive
As AI tools become part of everyday life, you may wonder how you could use them elevate your data science workflow and communicate information to your audience. Come with us to explore our AI toolbox and embark on a path towards enhanced efficiency, innovation, and success in your data science endeavours. We will discuss the capabilities of AI tools such as ChatGPT API, Phind, and Firefly to support data-driven workflows and outputs, and their potential to transform how we work with and visualise data.
12:20pm
Q&A
12:30pm
Networking lunch
2:00pm
High Performance Sport NZ: Our data journey
High Performance Sport NZ
Come along with us on our journey as we reflect on the ups and downs our intelligence team faced during our first five years at High Performance Sport NZ. We’ll tell you about our growth, highlight important lessons we’ve learned, and explain how we’re using R as the foundation of our intelligence and analytics work.
2:30pm
How to create insight that is approachable and engaging
Te Whatu Ora - Health New Zealand
Analytics is plagued with smart people. It’s a blessing and a curse. The blessing is that we can inform large scale decisions through our work, the curse is that analytics is an amorphous blob for those on the outside. Too often, I see incredible work being overlooked because people simply don’t understand it and don’t relate to it. Over the course of this talk, I will talk through critical points in getting your message across and getting your audience to engage with the work but to save you some time, the answer to the question, “How do you create insight that is approachable and engaging?” is, “it depends”.
2:45pm
Leveraging dynamic reports for management consulting and political polling
InsightsPortal | University of Sydney
The presentation will explore how data can be presented across commercial and political landscapes, with the goal to harmonise requirements of both consumer psychology and political science within one application. Insightsportal.com is used as a show case for the seamless integration of R-based Tools and Quarto to support automated and standardised reporting of insights across various domains. The talk demonstrates and reflects on how custom tools can facilitate informed decision-making and contribute to strategic decision-making in the political arena.
3:05pm
An unexpected R Shiny journey: Time series forecasting modelling from SQL to R
Department of Corrections, Ara Poutama Aotearoa
It has been more than 2 years since R was introduced to the Health Insight and Analytics team. From simple R Markdown reporting for COVID-19 vaccination rates to R Shiny dashboards used to inform mental health and medical healthcare services it has been quite the journey. In this talk Jing will highlight one of the R Shiny dashboards built to enhance time series forecasting analysis using SQL and R.
3:20pm
Q&A
3:30pm
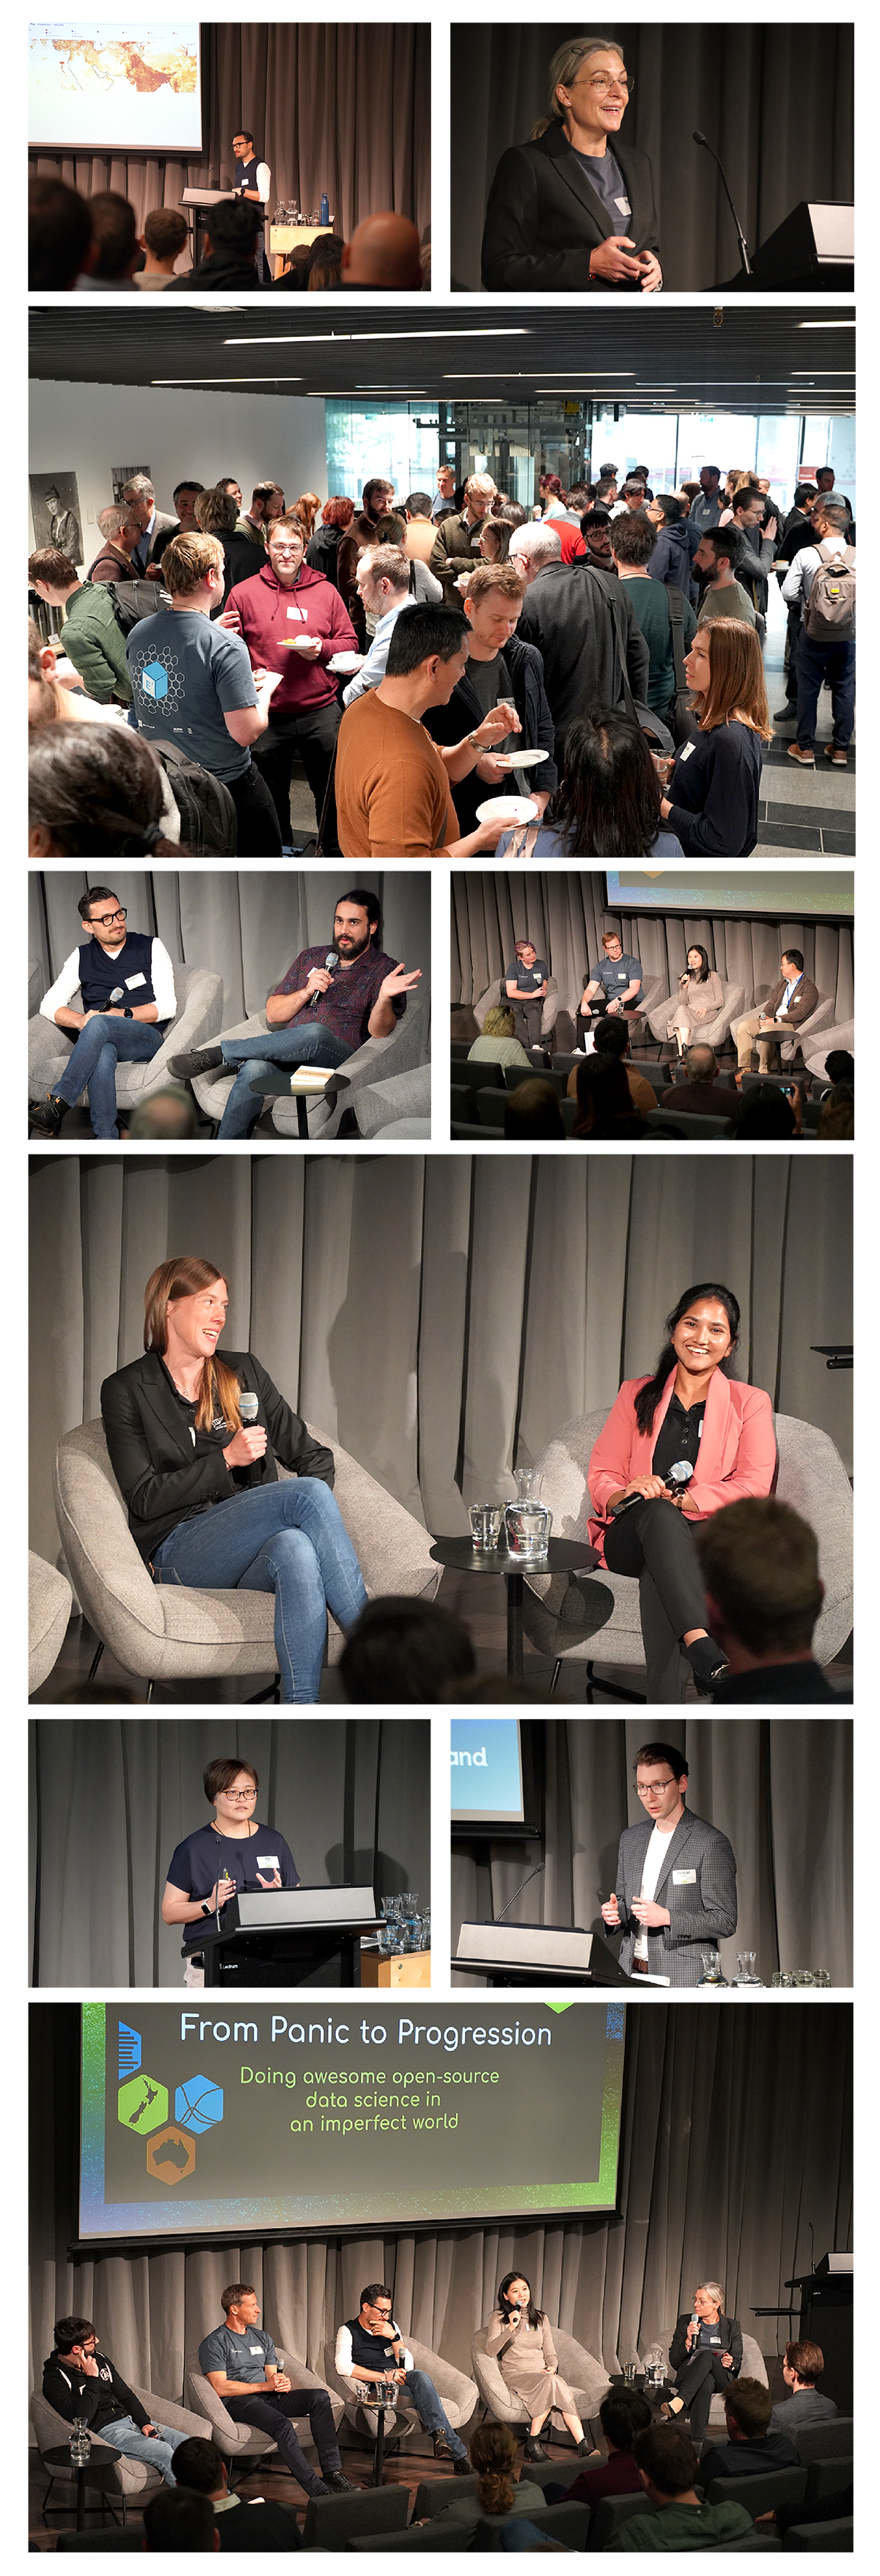
From Panic to Progression
Doing awesome open-source data science in an imperfect world
Our public and private sector experts will explore the challenges and opportunities of navigating today's data science landscape. From coping with uncertainty to leveraging innovative tools and fostering a data-driven culture, our panelists will share insights and strategies for thriving within the ever-evolving field of data science.
4-6pm
Networking
Nibbles and drinks provided
Gallery

